Bitcoin and Ethereum appear to have reached a crucial support level after posting considerable losses on the news of a new Covid variant in South Africa. The significant demand wall could determine whether BTC and ETH will dip further or resume their uptrends.
Crypto Market Suffers Crash
Cryptocurrency investors appear to have entered a state of “fear ” over the news that a new Covid variant was identified in South Africa. The variant was first identified Tuesday and panic has ensued throughout the week, with several countries in Europe and Asia issuing travel bans to southern Africa.
Alongside the crypto market dip, the FTSE 100 fell 3% Friday, while oil prices also tumbled. Dow futures are down 700 points in anticipation of a bloody market opening.
The sudden spike in selling across the cryptocurrency industry has resulted in the total market capitalization shaving off 9% of its value in the last 12 hours. Around $350 billion was wiped out of the market, and more than $530 million was liquidated across the market within the same period.
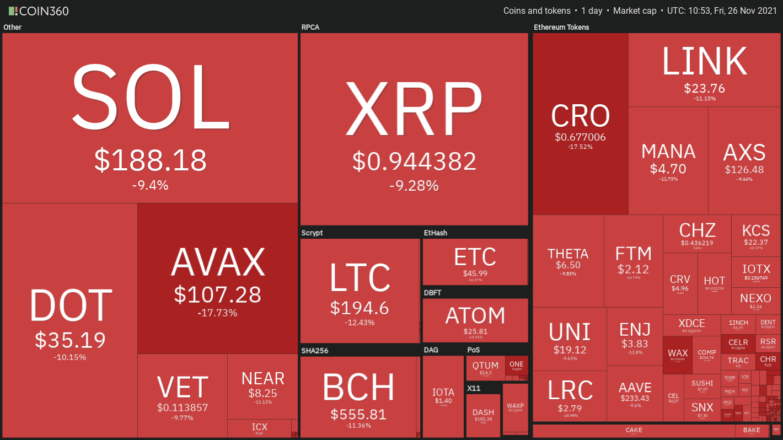
Avalanche’s AVAX, Crypto.com’s CRO, and Cosmos’ ATOM rank among the biggest losers, each crashing by more than 17%. Bitcoin and Ethereum also incurred significant losses but appear to be holding on a stable support.
Bitcoin, Ethereum Hit Make-Or-Break Point
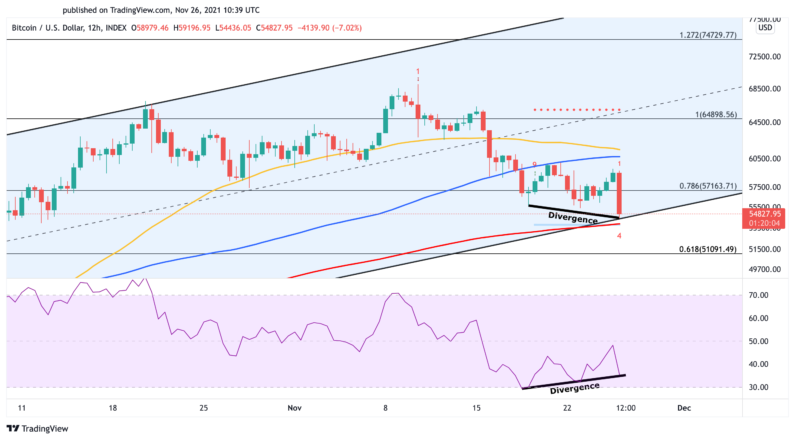
Bitcoin fell 8% shortly after being rejected by the $60,000 resistance zone.
The downswing was significant enough to push prices down to test the lower boundary of a parallel channel, where BTC has been contained since mid-June. The crucial support level coincides with the 200-twelve-hour moving average at $54,000.
There is a high probability Bitcoin could bounce off this demand zone because every time prices have dropped to the channel’s lower trendline since mid-June, the downtrend has reached exhaustion, leading to a bullish impulse to the pattern’s middle or upper edge. Similar market behavior could now occur, especially when considering a bullish divergence forming on the 12-hour chart between the relative strength index or RSI and the price of BTC.
If buy orders increase around the $54,000 support level, Bitcoin could bounce toward $65,000 or even make a new all-time high at $75,000.
However, a sustained 12-hour candlestick close below $54,000 could invalidate the bullish thesis. Under such unique circumstances, BTC could drop to $51,000 or even $47,000.
Ethereum has also reached a crucial area of demand after experiencing a 12% price correction.
The $3,985 support level has so far prevented the number two crypto from incurring significant losses over the past month. Each time ETH has hit this critical interest zone since Oct. 20, prices have swiftly rebounded. The recent retest could now represent the last opportunity for sidelined investors to get back into the market.
A spike in buying pressure around the $3,985 zone could put Ethereum back on track to meet the $9,000 target presented by a cup and handle pattern.
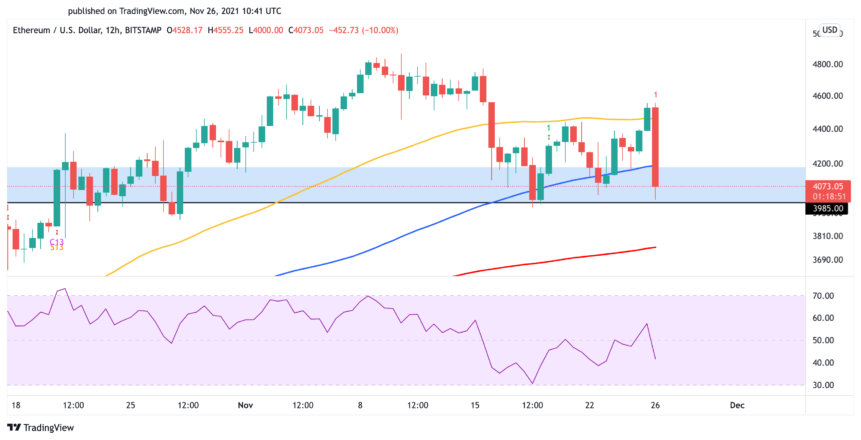
It is worth noting that a decisive 12-hour candlestick close below the $3,985 support level could invalidate the optimistic outlook. Breaching such a significant demand wall might encourage investors to exit their positions in anticipation of further losses quickly. The sell-off could then push Ethereum to the 200-twelve-hour moving average at $3,700 or even $3,300.
Source: cryptobriefing.com
 (Оценок еще нет)